We’ve all seen beautiful images of outer space, with vivid swirls and bright stars resting on a black abyss. With how quick it is to snap a color photo on an iPhone, you might think that sophisticated space telescopes churn out color photos automatically, too.
However, all digital cameras—from your phone to the James Webb Space Telescope—can’t actually see in color. Digital cameras record images as a bunch of ones and zeros, counting the amount of light hitting their sensors. Each pixel has a colored filter over it (either red, green, or blue), which only allows specific wavelengths of light to go through. The filters are arranged in a specific pattern (typically a four-pixel repeating square known as the Bayer pattern), which allows the camera’s computing hardware to combine the captured data into a full-colored image. Some digital cameras spread the colored filters out across three individual sensors, the data from which can similarly combine into a full-color image. Telescope cameras, however, have to take images with one filter at a time, such that they have to be combined by experts later into a composite image.
Processing scientific data into beautiful color images is actually a full-time job.
In our smartphones, the combination of layers happens incredibly fast—but telescopes are complicated scientific behemoths, and it takes a bit more effort to get the stunning results we know and love. Plus, when we’re looking at the cosmos, astronomers use wavelengths of light that our eyes can’t even see (e.g. infrared and X-rays), so those also need to be represented with colors in the rainbow. There are lots of decisions to be made about how to colorize space images, which begs the question: who is making these images, and how do they make them?
For the spectacular results we’ve been seeing from JWST, processing scientific data into beautiful color images is actually a full-time job. Science visualization specialists at the Space Telescope Science Institute in Baltimore stack images together and stitch observations from different instruments on the telescope. They also remove artifacts, or things in the image that aren’t actually real, but instead just results of the telescope equipment and how digital data is processed. These could be streaks from stray cosmic rays, oversaturation of the brightest stars, or noise from the detector itself.
Black and white to color
Before they even think about color, these specialists need to balance out the dark and light values in the image. Scientific cameras are meant to record a wide range of brightnesses beyond what our eyes can pick up on. This means that the raw images from telescopes often look very dark to our eyes, and you have to brighten up the image to see anything.
Once they have black and white images where the details are visible, they start adding color. “Different telescopes have filters that are made to be sensitive to only certain wavelengths of light, and the colorful space images we see are combinations of separate exposures taken in these different filters” similar to the earlier description of a phone camera, explains Katya Gozman, an astronomer at the University of Michigan. “We can assign each filter to a separate color channel—red, green or blue, the primary colors of visible light. When stacked on top of each other, we get the spectacular textbook color image that we’re used to seeing in the media,” she adds.
This is where it becomes a bit of an art, choosing colors based on not only scientific accuracy, but also what looks best. For JWST and Hubble, the usual routine is to use blue for the shortest wavelengths, green for in between, and red for the longest wavelengths.
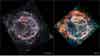
The end result, of course, also depends on what kind of data the image specialists have to work with in the first place. The team often chooses different colors to highlight the fact that NIRCam and MIRI—two of Webb’s infrared cameras—are looking at different wavelengths (near-infrared and mid-infrared, respectively), and therefore different physical structures. For example, in the Cassiopeia A supernova remnant, JWST’s observations revealed a bubble of something emitting a specific wavelength of light, colored as green in the MIRI image and resultantly known as the “Green Monster.” Without this visualization, astronomers may not have noticed such a curious feature that provides insight into how giant stars die—and after some investigation, they figured out the Green Monster is a region of debris disturbed by the huge blast from the supernova explosion.
Invisible to visible
Generally, image specialists try to keep things as close to reality as possible. For example, if a telescope is observing in visible light, wavelengths can directly map to colors we’re used to seeing. But for those parts of the spectrum invisible to our eyes, they have to make choices about which visible colors to use. This is where it becomes a bit of an art, choosing colors based on not only scientific accuracy, but also what looks best. For JWST and Hubble, the usual routine is to use blue for the shortest wavelengths, green for in between, and red for the longest wavelengths. If there are more than three different filters to choose from (as is often the case with JWST, especially when using more than one of its high tech instruments), sometimes they’ll add in purple, teal, and orange for other wavelengths in between the red, green, and blue.
Color images are far more than a pretty picture, though—they’re actually quite useful for science. The human brain is excellent at picking up patterns in color, such as parsing a map with color-coded subway lines or recognizing that “a red light is stop, green is go,” says Mark Popinchalk, an astronomer at the American Museum of Natural History. “These are daily examples where societal information is presented and processed quickly through color. Scientists want to use the same tool,” he adds. “But instead of societal information, it’s scientific. If X-rays are red, and ultraviolet is blue, we can very quickly interpret energetic light beyond what humans are capable of.” The result is a visual representation of an intense amount of data–much more than can be processed with the naked eye, or in black and white alone.
For example, Gozman describes how images have helped recognize “where different physical processes are happening in an object, such as seeing where star formation is happening in a galaxy or where different elements are located around a nebula.” Color images with light beyond the visible spectrum have even revealed dark matter around galaxies, such as in the bullet cluster.
[ Related: This is what Uranus and Neptune may really look like ]
Another particularly recent and interesting example of image coloration is the case of Neptune. The dark blue photo of the icy world from the Voyager mission doesn’t actually reflect its true color, as if we were looking at it with our own eyes—instead, it’s more similar to the pale face of Uranus. “Back in the 80s, astronomers actually stretched and modified the images of Neptune to bring out more contrast in some of its fainter features, leading it to have that deep blue hue which made it look very different compared to Uranus,” explains Gozman. “Though astronomers were aware of this, the public was not. This is one good example of how reprocessing the same data in different ways can lead to completely different representations.”
Image analysis is, and always has been, a huge part of astronomy, finding ways to see the cosmos beyond the limitations of our very limited human eyes. You can even try your own hand at it—JWST data is available to the public from NASA, and they even run an astrophotography challenge open to anyone. Now, when you see a beautiful image of space, perhaps you can think of it as a wonderful melding of science and art.

